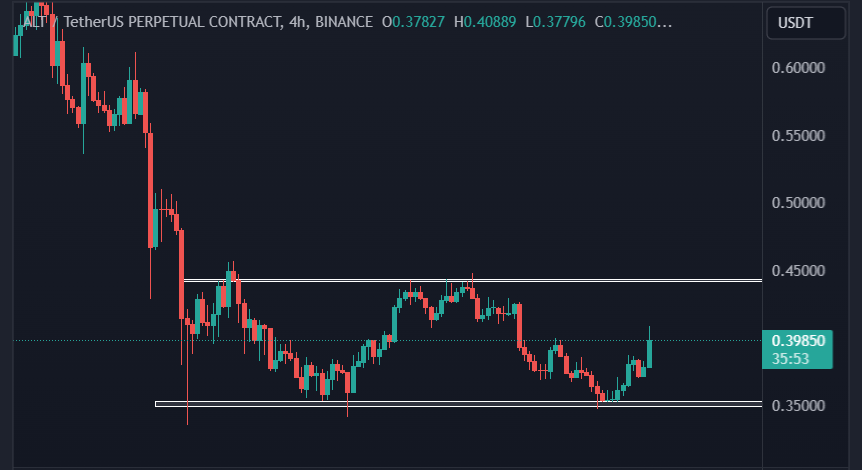
Altlayer (ALTUSDT), a popular altcoin trading pair, has caught the attention of traders and analysts alike due to a potentially bullish technical pattern forming on its charts.

Tripple Bottom Formed by Altlayer (ALT)
Over the past couple of weeks, ALTUSDT has been trading in a narrow range and finally formed what is known as a “triple bottom” chart pattern around the 0.35 level. This candlestick chart pattern is often considered a bullish signal, indicating that the token is poised for a trend reversal and price might increase now.
Traders should closely monitor chart patterns to identify potential trading opportunities and market sentiment shifts. The triple bottom pattern is three consecutive lows at roughly the same price level, here at 0.35 USDT levels, with each low being met with diminishing selling pressure. This pattern suggests that bears are gradually losing control, and bulls are becoming more aggressive, potentially setting the stage for a bullish reversal and price to increase.
Checkout the live price action on TradingView. Trading view is the most trusted and feature rich platform to carry out all the trading analysis. With premium plans you can do multi timeframe analysis on same screen and get as low was 1sec timeframe charts.
Bull Trend Confirmation
Altlayer has also been creating higher highs and higher lows on the 1-hour timeframe. This confirms a potential uptrend, as it indicates that the token is consistently making higher peaks and finding support at higher levels, meaning bears are losing their strength and bulls are becoming powerful.
Moreover, the trading volume on the 4-hour timeframe has spiked to approximately four times the average trading volume. Source: Binance Futures. This explosive increase in volume can be viewed as a confirmation signal, suggesting that traders are actively trading ALTUSDT, and there is growing confidence among traders in the potential bullish trend.
What’s next for Altlayer
If the bullish momentum continues, the 0.44 level is the next potential resistance zone for ALTUSDT. We can expect a 10% rally to this zone from the current price. A break above this level could potentially pave the way for further gains.
However, it’s important to note that while the technical indicators are pointing towards a potential bullish trend reversal, traders should wait for consolidation before entering positions. Consolidation periods can increase the probability of a sustainable uptrend by providing a stable base for further price appreciation.
Overall market sentiment plays a crucial role in shaping token’s prices, and the overall sentiment surrounding the broader cryptocurrency market will undoubtedly influence Altlayer’s price trajectory.
“However, it’s important to remember that technical analysis is not a crystal ball, and traders should always implement proper risk management strategies.”
To sum it up, the formation of a triple bottom pattern and the presence of higher highs and higher lows on ALTUSDT’s charts, coupled with a surge in trading volume, have sparked interest among traders. While these technical indicators suggest a potential bullish trend reversal, caution and proper risk management strategies are advised. Market participants will undoubtedly continue to closely monitor ALTUSDT’s price movements, as well as the broader cryptocurrency landscape, in search of further clues and opportunities.
Checkout more crypto news. Disclaimer: This is not a financial advice. Please do due diligence before getting involved in any trades or investments.